
How to Set Up Your Agencies’ Reporting Infrastructure
Your Simplified, Comprehensive Guide to Data Tools, BI Platforms & Client Dashboards

Clients want and expect more from marketing agencies now. Execution alone won’t cut it. To lead in this market, the most successful agencies operate as strategic partners, expected to deliver clear, measurable ROI evidence. That shift makes reporting no longer a backend task, but a core growth asset. Agencies that master a scalable, client-ready, white-label reporting infrastructure not only retain clients longer but also differentiate themselves, command higher fees, and grow with sustainable confidence and a reputable backbone.
In fact, 56% of agency leaders say clearly understanding client needs is the top factor in converting prospects into customers, and modern reporting addresses this.
When prospects can immediately see performance, understand impact, and connect your work to business outcomes through clean, professional dashboards, you’re already operating like their partner.
TL: DR What You’ll Learn
This guide shows you how to:
- Architect a reliable data foundation
- Select the correct data and BI tools
- Design dashboards that clients instantly understand
- Deliver white-label reporting as a revenue product
If you have questions or want deeper clarity on any part of this framework, contact us. Otherwise, let’s dive in.
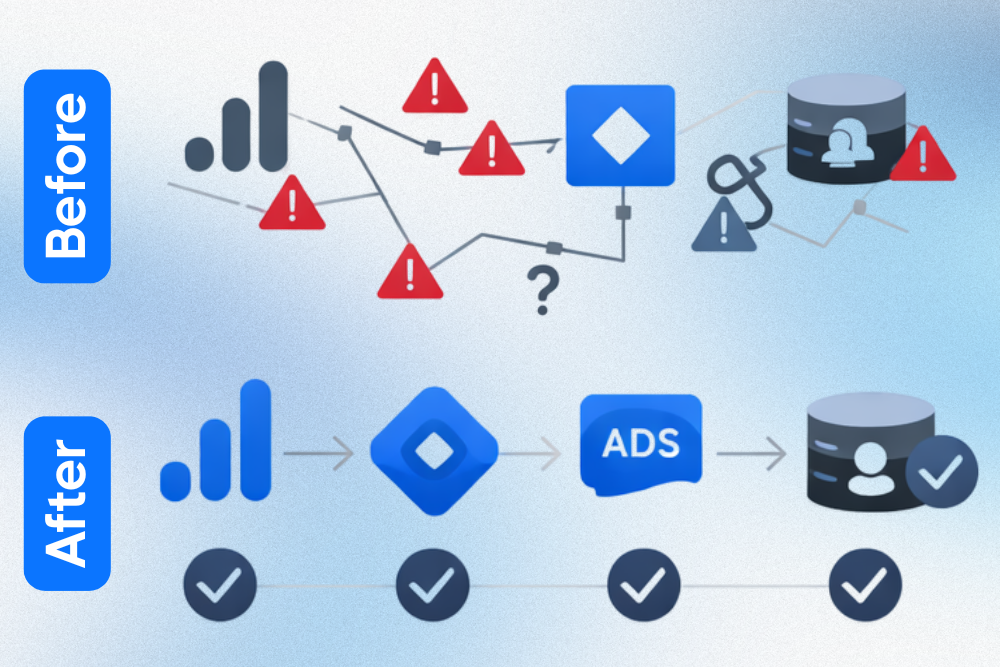
The Current Problems With Most Agency Reporting
Overcoming Reporting Inefficiencies and Demonstrating Value
Many agencies grapple with significant reporting inefficiencies that materialize as fragmented data sources, manual compilation processes, and a lack of standardized methodologies that result in time drains and increased operational costs.
➜ “We can’t see it.”
➜ “We can’t attribute it accurately.”
➜ “It takes a lot of time and resources we don’t have the internal overhead for, so it’s impossible to realistically scale without reducing quality.”
The sheer volume of data generated daily across diverse channels, from social media metrics to campaign performance, can be overwhelming. Furthermore, translating this raw data into meaningful insights that clients can readily understand and act upon is a persistent challenge.
Many agencies struggle to move beyond vanity metrics, failing to connect their efforts directly to a client's bottom line, which can erode trust and hinder retention.
How to Turn Reporting Into Your Agency’s Competitive Advantage
A Holistic, White-Label Reporting Portfolio
Agencies that move beyond fragmented reporting and toward a strategic, automated, dashboard-driven infrastructure see measurable business benefits because clients get the clarity they’re after.
When surveyed, 74% of agency leaders say clients most value clear data visualization in their reports, which isn’t surprising given that most agencies already monitor 3–5 data sources per client. When your reporting spans multiple platforms, you’re already showing a massive competitive advantage.
Even more compelling, mature Business Intelligence (BI) and dashboard systems dramatically improve how teams make decisions. Organizations that fully embrace BI reduce data analysis time by up to 73% and increase decision accuracy by around 45%, directly boosting operational productivity and strategic impact.
This is your competitive advantage.
If you’re able to deliver a cohesive, white-label reporting portfolio that:
- Aggregates data from every client platform into a single, reliable source
- Models and cleans it so you can trust every number
- Visualizes it in dashboards built for clarity, not clutter
- Delivers it to clients in a branded experience that reinforces professionalism
Then you’re promising a strategic service that provides:
- Consistency in month-to-month insights
- Clear illustrations of ROI that speak your client’s language
- Time back for your team, now spent on strategy, not assembly
- A reporting experience that feels like a product
- Brand value and deepened client engagement
When reporting becomes a productized, white-label service, it becomes a direct revenue lever. Agencies that implement this level of reporting consistently close deals faster, raise retainers, extend client lifetimes, and unlock expansion revenue because they’re selling clarity, control, and confidence, and that’s priceless.
Reporting Considerations: The Foundation Most Agencies Skip
Before building dashboards, define the system constraints that make reporting reliable and scalable.
☐ Identify All Relevant Data Sources for Comprehensive Reporting
This includes website analytics (e.g., Google Analytics), social media platforms (e.g., Facebook, Instagram, LinkedIn), advertising platforms (e.g., Google Ads, Meta Ads), CRM systems, email marketing platforms, and any other relevant business intelligence tools. For campaigns involving influencers, tracking their performance and reach through specific mentions and engagement metrics is also vital.
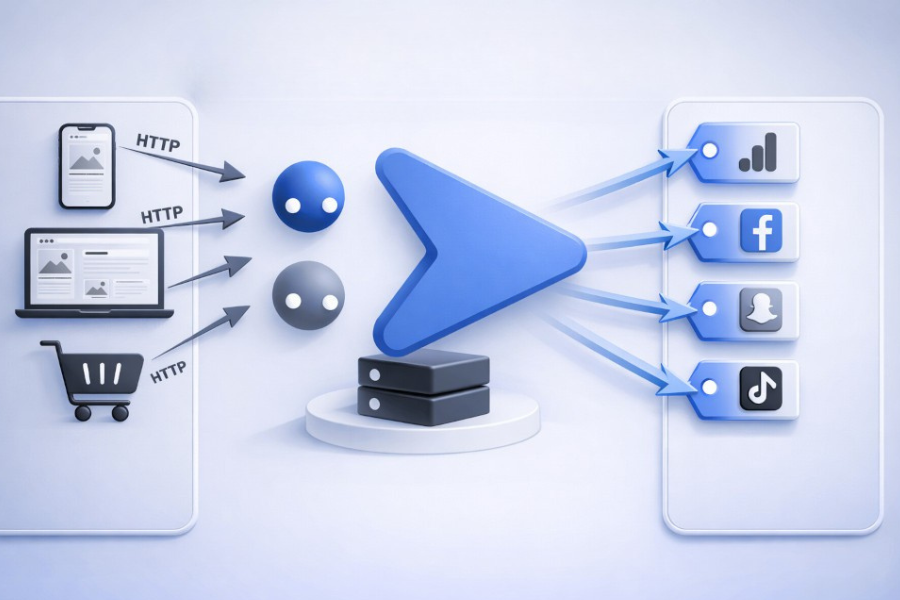
☐ Centralize Data: Connectors, APIs, and Data Warehousing
Once identified, these disparate data sources need to be centralized through robust data aggregation methods.
Modern reporting tools offer a wide array of connectors that can pull data directly from platforms. Embracing a tool-first approach assures seamless integration and data flow. For agencies managing complex data requirements or a high client volume, establishing a data warehouse can provide a single source of truth, ensuring data consistency and accessibility for all reporting.
☐ Validate Data Quality and Consistency for Reliable Insights
Data accuracy and consistency are non-negotiable for building client trust; therefore, implementing rigorous data validation processes is essential. This involves cross-referencing data from different sources, cleansing erroneous entries, and establishing clear data governance policies. Reliable insights stem directly from high-quality data, making this step critical for the integrity of the entire reporting portfolio.
☐ Integrate Reporting into Your Workflows (project management, client onboarding)
Reporting processes must be seamlessly integrated into the agency's overall workflows. This includes incorporating reporting tasks into project management systems and ensuring clear reporting protocols are part of the client onboarding process. Defining roles, responsibilities, and reporting timelines ensures consistency and accountability across all projects.
Once these boxes are checked, you’re ready to build. ☑
Build Your Agency’s Reporting Infrastructure
Now that you know the why and have built the foundation, it’s time to move ideation into implementation.
Step 1: Select the Right Data Tool
Your data layer determines how far your reporting can scale because every limitation in your data pipeline becomes a limitation in your client service, your team’s efficiency, and your revenue model.
If your data ingestion is fragile, slow, or inconsistent:
- dashboards break,
- numbers don’t match,
- your team spends hours fixing reports,
- and your agency caps its own growth.
On the other hand, when your data layer is clean and reliable, everything above it becomes easier: modeling, visualization, delivery, and client trust.
That’s why the first decision you make; how data enters your system, is the most important one.
You have two routes:
Step 2: Format & Model the Data
Without a Database
If you’re using Excel or direct connectors in Looker Studio, most formatting is handled automatically.
With a Database (Recommended for Scaling)
Use dbt to model your data and implement the Medallion Architecture:
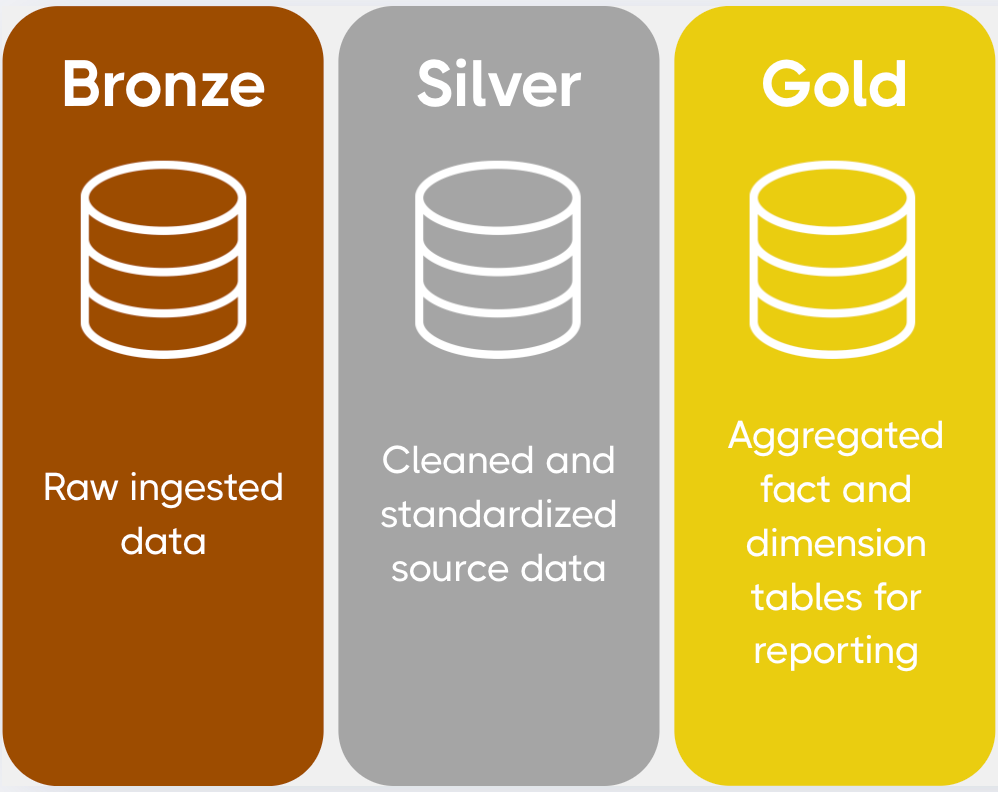
This structure delivers consistency, performance, and trust in every metric.
Critical for Agencies: Client Data Isolation
Every dataset must include a client_id parameter and enforce row-level security to guarantee that a client can never see data that doesn’t belong to them. This is foundational for white-label reporting.
Step 3: Select the Right BI Tool
Your BI layer defines how clients experience your work, as it’s the interface between your data and your client’s trust.
Here’s how to triage which is best:
If you need free, fast, and simple, use Looker Studio.
If you sell high-end reporting as a product, use Omni.
If your clients live inside Microsoft ecosystems, use Power BI.
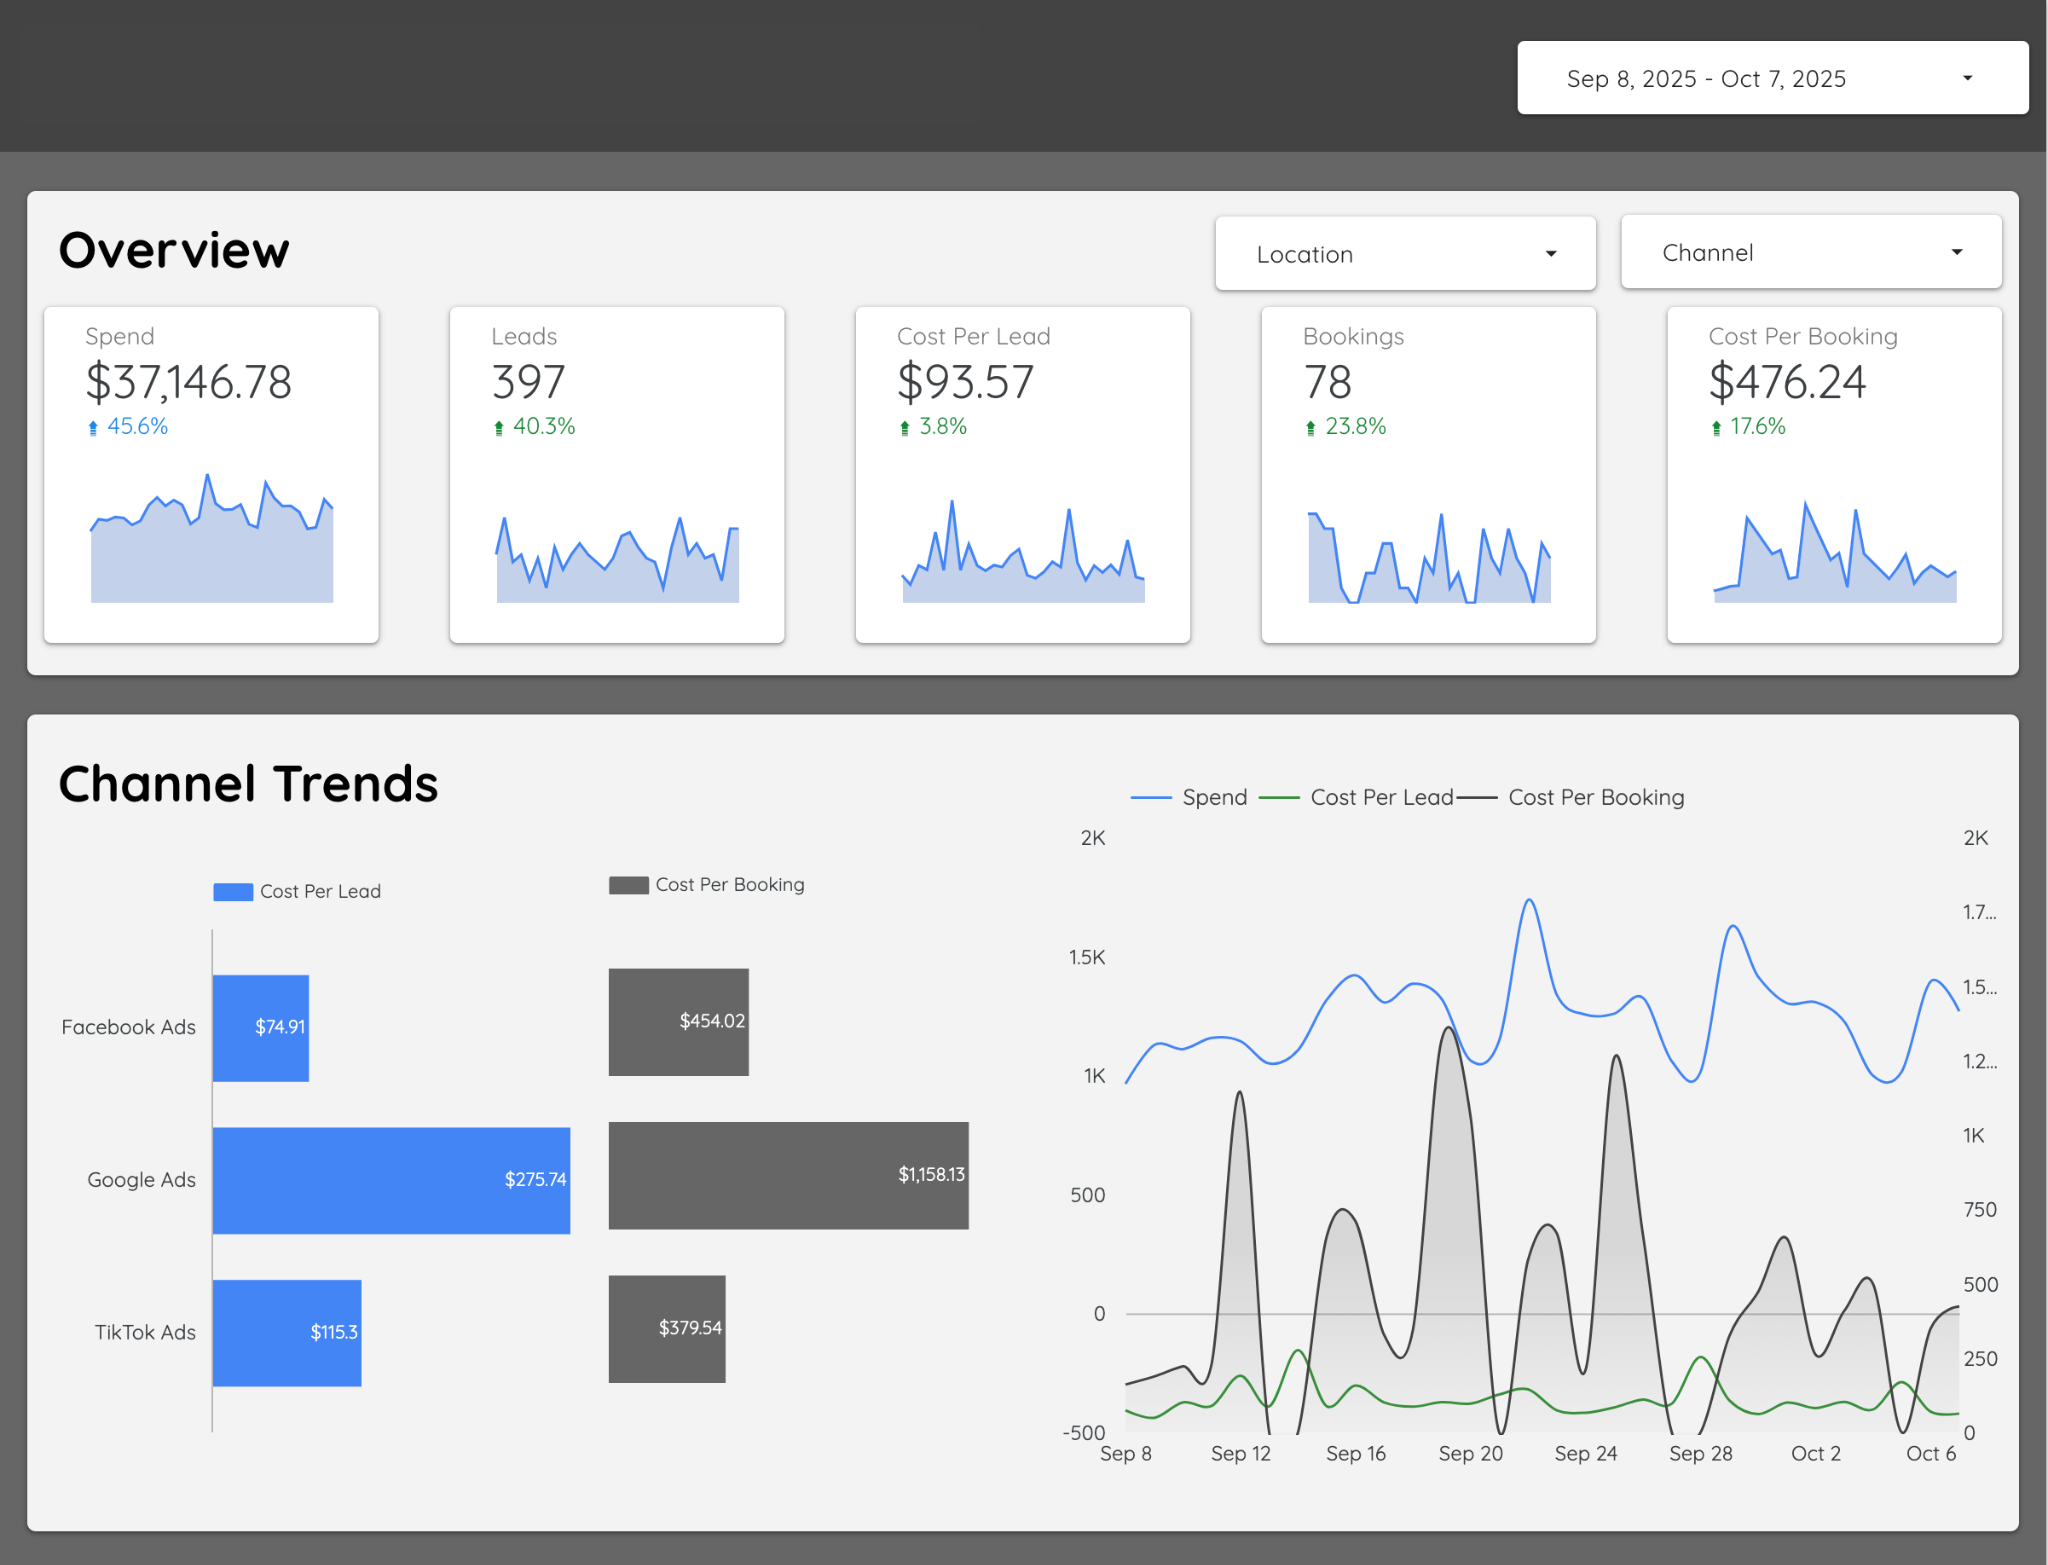
Step 4: Design Dashboards Clients Instantly Understand
Clients don’t judge your work by how much data you show; they judge it by how quickly they understand what’s working, what’s changing, and what it means for their business. That understanding is what feeds confidence, retention, and expansion.
4.1 Start With Primary KPIs
Before you design anything, consider how you define success for this client; those answers become your primary KPIs.
Make these KPIs visually dominant, front and center, and easy to see at a glance. Place them at the top of the dashboard, as they’re the primary anchor of the entire reporting experience.
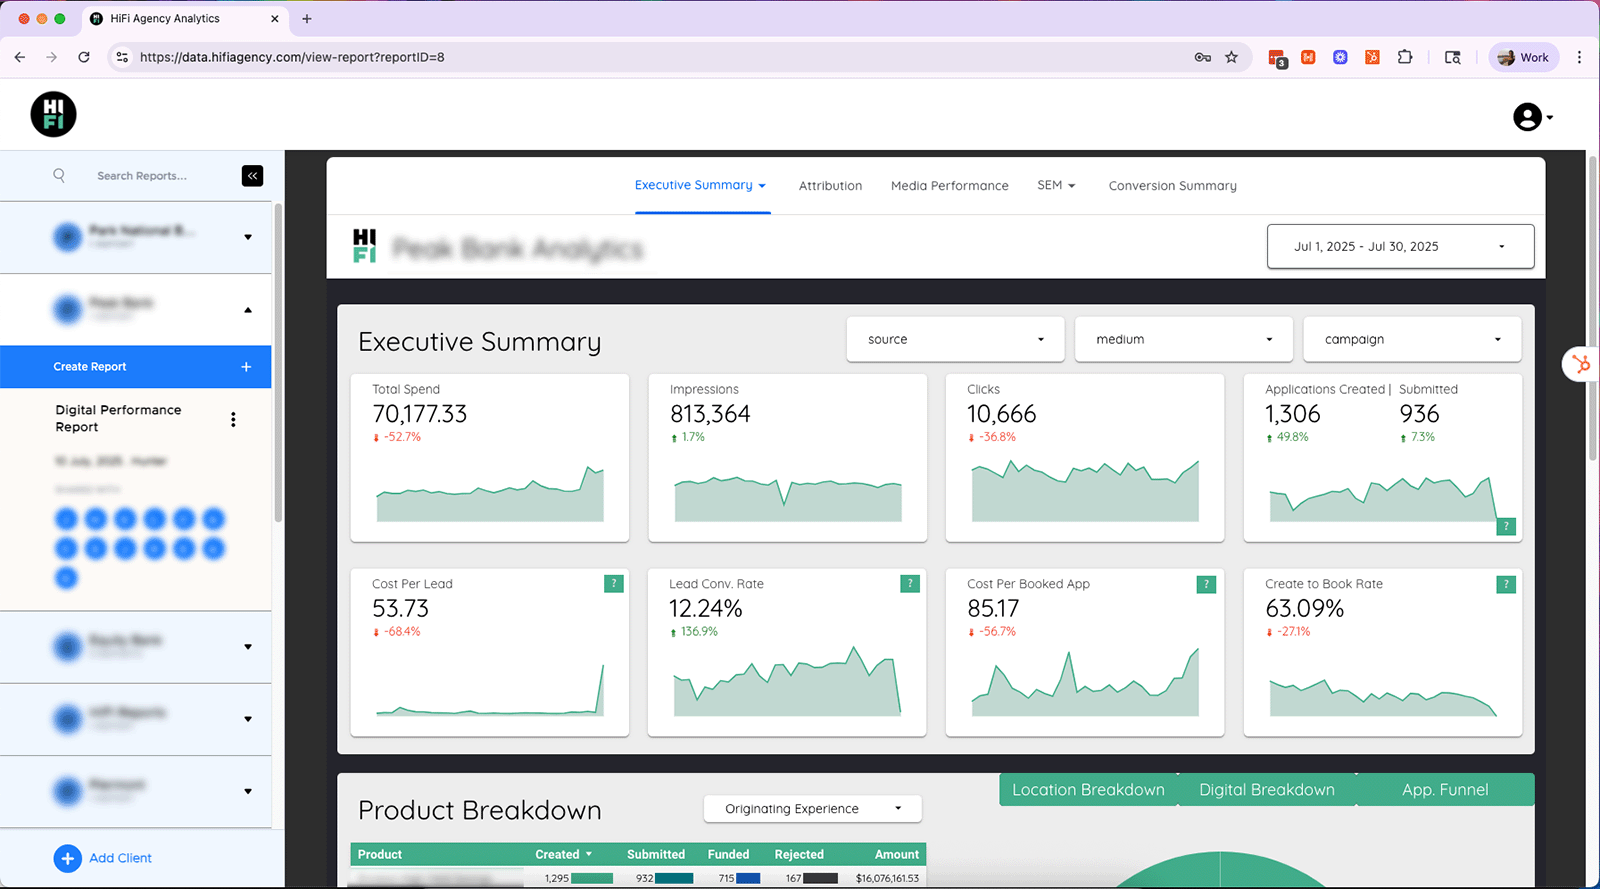
4.2 Build the Explanation Layer
Each chart below your primary KPIs must explain why the numbers change.
Ex: If your primary KPI is Revenue, your explanation layer might include:
The goal is to tell a story that explains performance, highlights achievements, and informs future strategy. Choosing the right chart types, such as bar charts for comparisons, line charts for trends, and pie charts for proportions, is crucial.
This structure tells a visual story that’s more consumable for all levels and roles, which brings us to the next must-do.
4.3 Design for Humans, Not Analysts
Your client should be able to understand the dashboard in 30 seconds or less.
That means no clutter, no unexplained metrics, no unnecessary visual noise, and no internal, bottlenecking jargon.
Use consistent color meaning, simple labels, and consider natural reading flow from top to bottom.
Litmus Test: If your dashboard requires a walkthrough every month, it’s too complicated.
4.4 Make It Feel Like a Product
A great dashboard feels like part of your agency’s service.
When clients log in and immediately see clarity, direction, and momentum, reporting stops being something they receive and becomes something they rely on.
That’s when retention and expansion begin to compound.
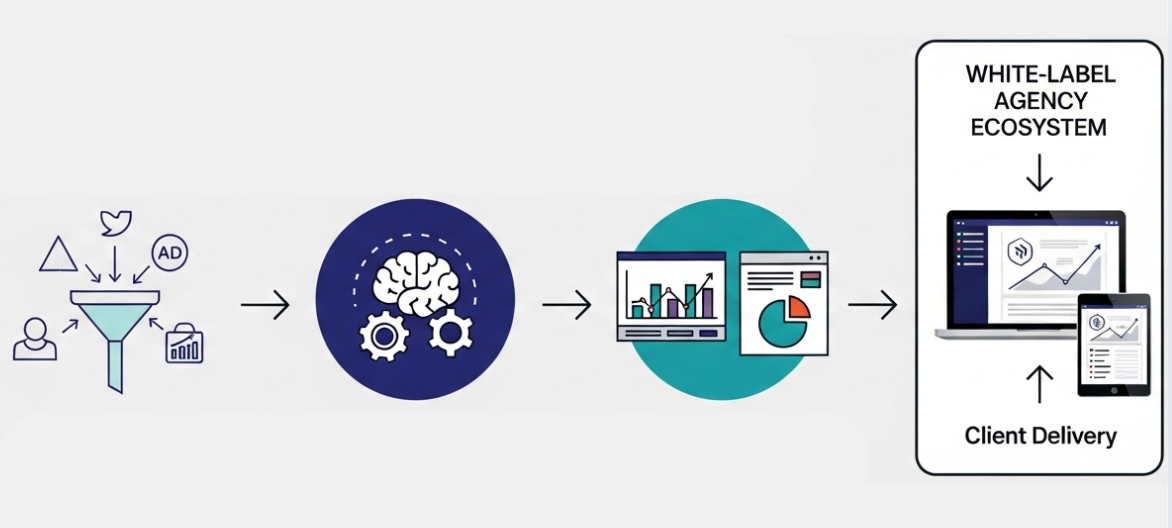
Why the Best Agencies White-Label Their Reporting
Build the system once, deploy it across every client, and let your reporting compound the value of everything else you do.
Leading agencies view white-label reporting solutions as a strategic growth decision, one that compounds benefits.
When every dashboard, report, and client portal carries your agency’s branding, your service feels unified, intentional, and premium. The experience signals maturity, reliability, and leadership before a single number is even discussed. Over time, this consistent presentation reinforces trust, strengthens your brand authority, and elevates how clients perceive your value across every interaction.
That’s why many agencies partner with MetricMaven’s white-label reporting solution. It provides the complete infrastructure: data pipelines, modeling, dashboards, delivery, and branding, so agencies can deploy this level of reporting under their own name without rebuilding everything from scratch.
Now, your agency moves faster in sales conversations, retainers increase, client relationships extend, and expansion opportunities surface naturally because you’ve differentiated yourself through the quality of insight you deliver and the confidence that insight creates.
Ready to add white-label reporting to your service suite?
Schedule a free consultation with MetricMaven and see how quickly your reporting can become your agency’s strongest growth asset.


Subscribe to our newsletter


Marketing analytics infrastructure for agencies. Server-side tracking, custom dashboards, and advanced analytics to improve marketing performance.