See Spark Go: Multi-Brand Franchise Development Dashboard

Scalable templated dashboard system tracking 10 franchise brands from ad spend through deal stages. White-labeled portal showing advertising performance to CRM conversion.

Contact us
See Spark Go: Multi-Brand Franchise Development Dashboard
Client
See Spark Go
year
Jan 2023
services
Client Reporting
platform
Looker Studio

Project overview

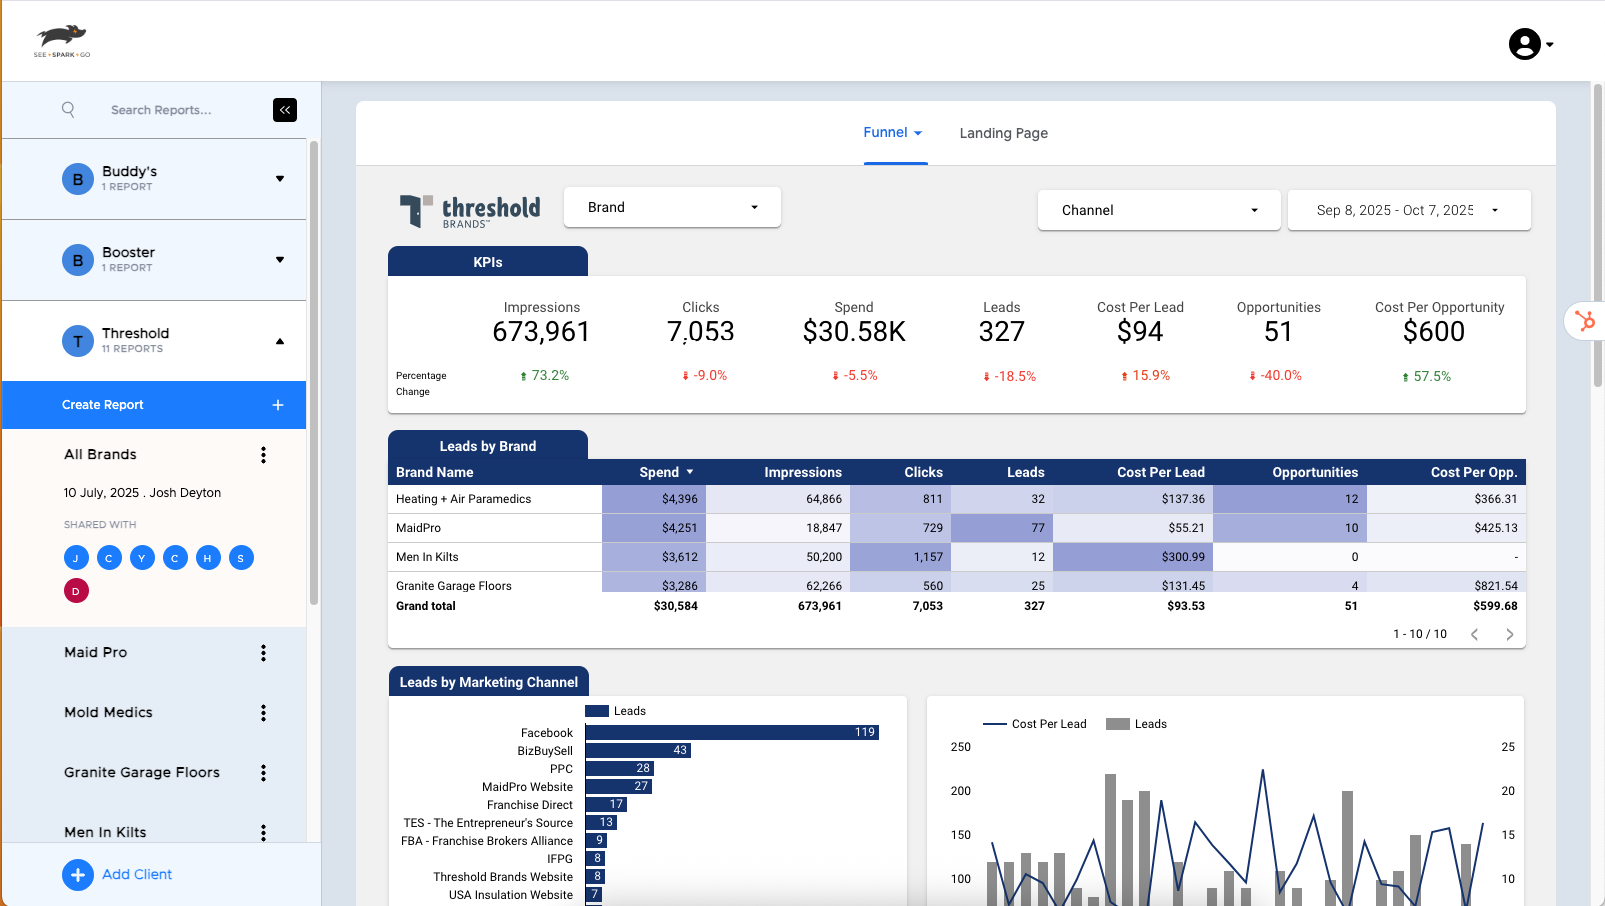
See Spark Go, a digital marketing agency, needed a sophisticated reporting solution for their client—a franchise development company managing 10 service brands in their portfolio. The client needed visibility into how advertising performance translated through deal stages in their CRM systems (HubSpot and Salesforce).

MetricMaven built a scalable templated dashboard system that consolidated Facebook Ads, Google Ads, HubSpot, and Salesforce data into unified reports. The solution included brand-specific dashboards, a portfolio-level overview, deal stage attribution, and landing page analytics—all delivered through a white-labeled client portal.

Result: Best-in-class lead generation dashboard scaling across 10 brands, with full visibility from ad spend to closed deals, enabling data-driven optimization across the entire franchise portfolio.

Execution

The Challenge

See Spark Go's client, a franchise development company, managed advertising and lead generation for 10 different service brands. They needed comprehensive reporting that connected advertising performance to actual franchise deals, but faced several obstacles:

Specific pain points:

  • Multi-brand complexity: Managing 10 distinct brands required separate reporting for each while maintaining portfolio-level visibility
  • Fragmented data sources: Ad performance lived in Facebook and Google, while leads and deals were split between HubSpot and Salesforce
  • Attribution blindness: No way to see which advertising sources actually drove closed franchise deals versus just leads
  • Manual reporting inefficiency: Creating individual reports for 10 brands would require unsustainable manual effort
  • Client visibility gap: No white-labeled way to give the franchise company access to their performance data
  • Landing page performance unknown: No tracking of scroll behavior or page effectiveness across brand landing pages

What We Built

We delivered a comprehensive, scalable reporting solution structured around templated data models and dashboards:

1. Data Integration & Infrastructure

Built a unified data pipeline consolidating all marketing and CRM sources:

  • MetricMaven Connectors: Configured automated extraction from Facebook Ads API, Google Ads API, HubSpot, and Salesforce
  • BigQuery Warehouse: Centralized data storage with schema designed for multi-brand architecture
  • Templated Data Models: Created a single dbt model template that could be replicated across all 10 brands using the same 4 platforms
  • Automated Refresh: Daily data syncs ensuring real-time reporting across all brands

2. Brand-Specific Dashboard Templates

Developed a repeatable dashboard structure deployed for each of the 10 brands:

  • Advertising Performance: Facebook and Google Ads metrics with spend, impressions, clicks, and cost per lead
  • Lead Generation Tracking: Lead volume and quality metrics from HubSpot and Salesforce
  • Deal Stage Progression: Movement through franchise development pipeline stages
  • Source Attribution: Which advertising sources contributed to each deal stage

3. Portfolio-Level Unified Dashboard

Created an executive view showing performance across all 10 brands:

  • Cross-Brand Comparison: Side-by-side performance metrics for all franchise brands
  • Portfolio Spend Analysis: Total ad spend and efficiency across entire portfolio
  • Best-Performer Identification: Quickly identify which brands and campaigns drive best results
  • Trend Analysis: Month-over-month and year-over-year portfolio performance

4. Deal Stage by Source Attribution

Built custom reporting logic connecting advertising to closed deals:

  • Source Tracking: Facebook Ads, Google Ads, organic, referral, and other lead sources
  • Stage Progression: Track leads through pipeline stages (inquiry → qualified → contract → closed)
  • Conversion Analysis: Which sources have highest conversion rates at each stage

5. Landing Page Analytics Implementation

Deployed comprehensive landing page tracking across all 10 brands:

  • Scroll Depth Tracking: Percentage of page viewed to identify engagement patterns
  • Landing Page Effectiveness: Conversion rates, bounce rates, and time-on-page metrics
  • Brand-Specific Insights: Individual landing page performance for each franchise brand

6. White-Labeled Client Portal

Created a branded portal for franchise company access:

  • Custom Branding: Portal matched See Spark Go's client's brand identity
  • Role-Based Access: Different views for different stakeholders
  • Self-Service Reporting: Clients could access dashboards 24/7 without requesting reports

Technical Architecture:

The solution used a templated approach where a single data model and dashboard design were created once, then replicated across 10 brands with brand-specific configurations. This architecture ensured:

  • Consistent reporting methodology across all brands
  • Efficient maintenance (fixes apply to all brands)
  • Scalability for future brand additions
  • Standardized metrics for portfolio comparison
See Spark Go: Multi-Brand Franchise Development Dashboard

Project results

The templated dashboard system successfully scaled across 10 franchise brands, providing See Spark Go's client with unprecedented visibility into their marketing performance and deal pipeline.

Business Impact

  • Best-in-class lead generation reporting: Comprehensive dashboards showing the complete journey from ad impression to closed franchise deal
  • Deal stage attribution: First-time visibility into which advertising sources (Facebook vs. Google vs. others) actually drive closed deals, not just leads
  • Landing page optimization: Scroll tracking and effectiveness metrics enabling data-driven page improvements across all 10 brands
  • Portfolio-level insights: Executive dashboard allowing franchise company to compare brand performance and identify best practices
  • White-labeled client access: Professional portal giving clients 24/7 access to their data without requiring See Spark Go intervention

What the Client Said

"MetricMaven built exactly what we needed: a scalable system that gives our franchise development client visibility they've never had before. Being able to see which ad sources actually drive closed deals—not just leads—has transformed how they allocate their marketing budget. And the fact that we can add new brands to the system without starting from scratch makes this a true competitive advantage for our agency."

— Josh Deyton, SVP of Digital, See Spark Go

What our customers say

What Our Great Customers Say - Devfy X Development Agency Webflow Template

MetricMaven greatly improved our ability to deliver the type of media attribution our company wants to bring to an industry that struggles with so many fragmented data siloes. Adding this service into our toolkit has allowed us to create room for our creative and media teams to test more, scale results faster, and grow into one of the strongest financial marketing agencies in the U.S.

Hunter Young
Founder, HIFI Agency
What Our Great Customers Say - Devfy X Development Agency Webflow Template

MetricMaven built exactly what we needed: a scalable system that gives our franchise development client visibility they've never had before. Being able to see which ad sources actually drive closed deals—not just leads—has transformed how they allocate their marketing budget. And the fact that we can add new brands to the system without starting from scratch makes this a true competitive advantage for our agency.

Josh Deyton
EVP, See.Spark.Go
What Our Great Customers Say - Devfy X Development Agency Webflow Template

This dashboard transformed how we operate. We went from spending hours every week creating reports to having real-time insights at our fingertips. Being able to see cost per booking by service type across all our platforms has dramatically accelerated how quickly we optimize campaigns.

Jonathan Wallace
Founder, Trovant Media
What Our Great Customers Say - Devfy X Development Agency Webflow Template

“MetricMaven has transformed the way we do data reporting to our partners at Kitchen Hub! With it's user-friendly interface, we effortlessly share detailed insights with our network of restaurant partners.

Fatima Ahmad
BI Lead at KitchenHub
What Our Great Customers Say - Devfy X Development Agency Webflow Template

“I have never had such a positive experience working with a company before. Jamie was clearly an expert from day one. He transformed our dashboard and integrations while being professional, prepared, and genuinely invested in our success.

Joe Formica
Founder, Bitesize UX
What Our Great Customers Say - Devfy X Development Agency Webflow Template

“Jamie was extremely helpful in helping us create a new Google Ad report template. He adapted the report to our needs and was patient and responsive with all of our questions. We will definitely be using him again for our next project.

David Luyendyk
Founder, Yellow House Design and Marketing